Last-mile delivery is the most expensive part of the logistics chain. It accounts for roughly 53% of total shipping costs. Not because the distances are long, but because the density is low, the stops are unpredictable, and the variables that drive cost upward are numerous.
For a delivery business running 10 drivers, getting from average to efficient typically means the difference between $8,000 and $5,500 in monthly operating costs for the same delivery volume. That $2,500 gap is not theoretical. It shows up in fuel bills, driver overtime, failed deliveries, and planning inefficiencies that compound quietly week after week.
This guide covers 10 strategies that actually move that number, with the dollar math behind each one so you can prioritise which to tackle first.
First: Know Your Cost Per Delivery
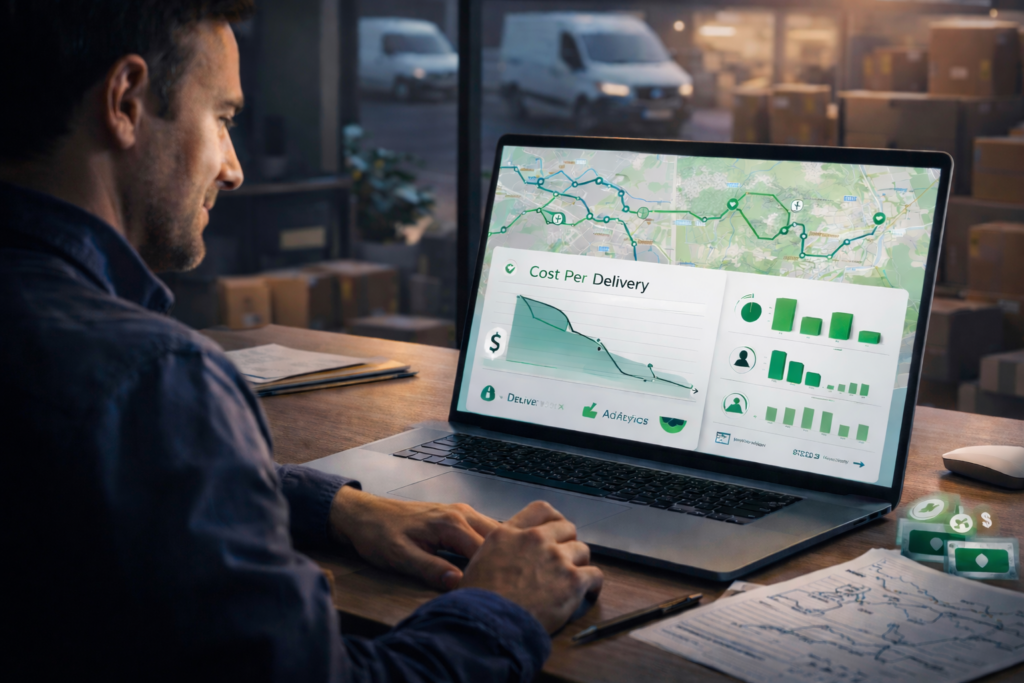
Before any of the strategies below are worth implementing, you need one number: your cost per delivery.
Most delivery operators know their monthly fuel bill and their payroll. Fewer know what each individual delivery actually costs them. Without this number, you cannot measure improvement, identify your worst-performing routes, or make a credible case for investing in software.
Calculating it is straightforward. Take your total monthly operating costs (fuel, driver wages, vehicle depreciation, insurance, platform costs, any maintenance) and divide by total deliveries completed that month.
For most SMB delivery operations, this number sits somewhere between $4 and $12 per delivery depending on route density, vehicle type, and stop complexity. Industry benchmark for optimised small-fleet operations is $3-5 per delivery. If you’re at $9-12, there is significant room to move.
Track this number monthly. Every strategy below should move it.
Strategy 1: Route Optimisation (With the Real Dollar Math)
Every article about reducing delivery costs mentions route optimisation. Few show what it’s actually worth.
Here is the calculation for a 10-driver fleet doing 50 stops per driver per day:
Poorly planned routes typically add 15-20 unnecessary miles per driver per day compared to optimised routes. At current fuel prices and average delivery vehicle consumption, that’s roughly $7-10 in wasted fuel per driver daily. For 10 drivers over 22 working days: $1,540-$2,200 per month in unnecessary fuel spend.
Add the planning time. Manual planning for 10 routes takes an experienced dispatcher 60-90 minutes per morning. Route optimisation software reduces this to 5-10 minutes. At a dispatcher salary of $20/hour, that’s $260-$390 per month in recovered labour time.
Route optimisation software for a 10-driver fleet costs roughly $300/month. The fuel savings alone cover that. The planning time savings are profit.
The implementation is straightforward with Bodha Fleet: import your stops via spreadsheet or API, set your constraints (time windows, vehicle capacity, driver shift times), optimise, and dispatch routes to drivers’ phones in minutes. Most operations see measurable mileage reduction in the first week.
Strategy 2: Cut Failed First-DeliveryAttempts
Failed deliveries are one of the most expensive and least-discussed cost drivers in last-mile logistics. Each failed first attempt costs an average of $15-25 in additional handling, re-dispatch labour, and vehicle time. If your operation does 200 deliveries per day and 5% fail on first attempt (a conservative estimate), that’s $150-250 per day in pure waste. Over a month: $3,300-$5,500.
The fix is almost entirely about customer communication. Most failed deliveries happen because the customer was not home. Most customers who are not home simply did not receive enough notice, or received it too late.
Automated SMS and email notifications sent when the driver is 30-60 minutes away give customers enough time to get home, ask a neighbour to accept, or communicate alternative instructions. Operations that implement proactive notifications consistently reduce failed delivery rates to 1-2% from industry averages of 5-8%.
The secondary fix is flexible re-delivery options. Customers who can specify a safe place or request a neighbour delivery via a tracking link cause far fewer failed attempts than customers who have no way to communicate instructions in real time.
Both capabilities, automated notifications and customer tracking links, are standard in modern delivery platforms. If yours does not have them, the cost of failed deliveries is likely exceeding the cost of upgrading.
Strategy 3:Increase Delivery Density Per Route
Every delivery route has fixed costs (the driver’s time, the vehicle’s fuel for the journey, the wear on the vehicle) that exist regardless of how many stops are on the route. The more stops you add to a route within a given area, the lower your cost per delivery becomes. This is delivery density, and it’s one of the highest-leverage cost levers available to small and mid-sized fleets.
Three ways to improve it:
Geographic clustering at dispatch. Before you assign stops to routes, sort and group them by neighbourhood or postcode. Stops in the same area belong on the same route. This sounds obvious and is routinely ignored in manual planning because it takes time to do properly. Route optimisation software does it automatically.
Time window management. If customers can pick any delivery window they like, some will pick windows that force drivers to cross town twice. If you offer windows that match your geographic routing (morning deliveries in zone A, afternoon in zone B), customers still get a choice but you get far better route density. Bringg data suggests this approach reduces miles per stop by 15-25%.
Order consolidation. If you have multiple small orders going to the same building or street, combining them into a single delivery run where possible reduces total stop count without reducing delivery volume. B2B deliveries and apartment blocks with multiple customers are obvious candidates.
Strategy 4: Address Driver Behaviour and Fuel Waste
Drivers covering the same routes in similar vehicles can have fuel costs that vary by 15-20% based purely on driving behaviour. Idling engines, harsh acceleration from traffic lights, speeding on short stretches, and unnecessary deviation from planned routes all add fuel cost without adding delivery value.
For a 10-driver operation with a combined monthly fuel bill of $6,000, a 12% reduction from behaviour improvement alone saves $720/month. Over a year, that’s $8,640 recovered without changing a single route.
The practical approach has two components. First, telematics or GPS tracking data (which most route optimisation platforms provide) shows you idling time, route deviation, and average speed patterns per driver. You don’t need expensive dedicated telematics hardware to start seeing this data. Second, simple driver scorecards reviewed weekly in a brief team meeting create awareness that changes behaviour without requiring confrontational management conversations.
The change is typically fastest when drivers understand that the data is there to identify operational issues, not to catch people out. Frame it correctly and most drivers respond well. They generally prefer efficient routes too.
Strategy 5:Improve Vehicle Load Planning and Utilisation
This is the most consistently overlooked cost reduction lever in small fleet operations. If your vehicles are leaving the depot at 60-65% capacity when they could leave at 85-90%, you’re either making more trips than necessary or running more vehicles than your actual delivery volume requires.
Two specific problems to address:
First, load order. Vehicles loaded in the wrong sequence (where the first delivery stop is buried under everything else) force drivers to spend 5-10 minutes at each stop rearranging the load. On a 40-stop route, that’s 3-7 hours of lost productivity per driver per day across your fleet. A loading manifest that maps packages to vehicle position by delivery sequence adds planning time upfront but saves far more on the road.
Second, vehicle-to-route matching. Sending a large van on a 15-stop residential route when a smaller vehicle would do increases fuel cost and makes parking harder. If you have mixed vehicle types in your fleet, matching vehicle size to stop density and package volume is worth the additional planning complexity.
Strategy 6: Manage Time Windows to Shape Route Efficiency
This is an operator-level decision that most businesses never make deliberately, and it’s worth thinking through.
When customers are given completely free choice over delivery time (any time between 8am and 6pm), the resulting stop distribution across your delivery area is essentially random. Routes that could be geographically tight become scattered because two customers in the same street want morning and evening deliveries respectively.
Offering structured windows (morning or afternoon, for example) that align with how you’ve zoned your delivery area lets customers feel they have a choice while dramatically improving your route density. Taking this a step further: offering a slightly reduced delivery fee for the window that fits your routing better incentivises customers to select the option that costs you less, without making them feel constrained.
This requires a shift in how you present delivery options but very little operational change. Operations that manage windows deliberately report 15-25% better route density compared to fully open windows.
Strategy 7: Calculate and Track Cost Per Delivery By Route and Area
Most operators who know their overall cost per delivery don’t know which routes or delivery areas are profitable and which are quietly losing money.
A route that goes 25 miles out of your usual area to serve a handful of customers might have a cost per delivery of $18 when the rest of your fleet is averaging $6. You might be unaware because the overall average hides it.
Breaking down cost per delivery by route, zone, or geographic area reveals which parts of your operation are efficient and which need to change, either through pricing adjustments, route restructuring, or, in some cases, the honest assessment that certain customers are not worth the delivery cost.
Most route management platforms capture the data needed to do this analysis automatically. The time investment is in reviewing it weekly and acting on what you find, not in gathering it.
Strategy 8: Preventive Maintenance to Avoid Unplanned Breakdowns
An unplanned vehicle breakdown mid-route triggers a cascade of costs that rarely show up on a single line in anyone’s budget. The immediate costs: emergency re-dispatch or route redistribution to remaining drivers, driver overtime to cover the additional stops, missed deliveries with potential penalty or re-delivery costs, and any roadside assistance or towing fees.
For a typical delivery operation, a single mid-day breakdown costs $500-1,500 in total when all the downstream effects are counted. A 10-vehicle fleet experiencing even two unplanned breakdowns per month is spending $1,000-3,000 monthly on a problem that a scheduled maintenance calendar largely prevents.
The fix is unglamorous: a simple preventive maintenance schedule with reminders. Oil changes at the right intervals, tyre pressure and tread checks weekly, brake inspections on schedule. Operations that maintain this discipline report breakdown rates 60-70% lower than those that do maintenance reactively.
If you’re managing a fleet without a maintenance log, starting one this week is one of the highestROI changes available to you at zero cost.
Strategy 9: Automate Customer Notifications to Cut Support Call Volume
A dispatcher who spends 2 minutes per call handling “where is my delivery?” enquiries and takes 25 such calls per day is spending nearly an hour of paid time per day answering a question that software can answer automatically.
At $20/hour that’s $400/month in dispatcher labour absorbed by customer queries that add no delivery value. In operations where the dispatcher is the owner, it’s their time, and that’s worth considerably more than $20 per hour.
Automated notifications (a message when the order is out for delivery, a second when the driver is approaching, and a delivery confirmation with proof of delivery photo) eliminate most of these calls before they happen. Operations implementing automated notifications consistently report 60-70% reductions in inbound support calls related to delivery status.
The secondary benefit is customer satisfaction. Customers who receive proactive updates without having to ask are measurably more satisfied with the delivery experience, which drives repeat orders. The cost reduction and the customer experience improvement happen simultaneously.
Strategy 10: Post-Route Analytics Review as a Weekly Practice
The previous nine strategies will reduce your delivery costs. This one keeps them falling over time instead of plateauing.
Every week, spending 30 minutes reviewing your route performance data will reveal patterns that are invisible in daily operations. A specific stop that consistently runs 20 minutes over planned service time has something that needs fixing: incorrect address data, an access issue, a customer who’s always difficult to reach. A route that runs 15% over planned mileage every Tuesday has a traffic pattern or deviation problem that can be corrected.
The metrics worth reviewing regularly are: planned vs actual arrival time per stop, planned vs actual total route time, miles driven vs planned miles, failed delivery rate by route and by zone, and cost per delivery by route.
Most modern delivery platforms capture all of this automatically. The operational discipline is not in gathering the data. It’s in actually sitting down with it weekly and feeding what you find back into next week’s planning decisions.
Operations that build this habit consistently reduce their cost per delivery by an additional 5- 10% per year beyond the initial improvement from the strategies above, simply by finding and fixing the recurring leaks.
How These 10 Strategies Stack Up Financially
For a 10-driver operation running 50 stops per driver per day, implementing all 10 strategies realistically looks like this:
Route optimisation: $1,540-$2,200/month in fuel savings Failed delivery reduction: $1,650-$2,750/month recovered (assuming current 5% failure rate drops to 2%)
Delivery density improvement: 15-20% mileage reduction, approximately $900-$1,200/month
Driver behaviour improvement: $500-$800/month in fuel recovered
Preventive maintenance: $500-$1,000/month in avoided breakdown costs
Automated notifications: $400/month in dispatcher labour recovered
Conservatively: $5,490-$7,950 per month in recoverable costs across a 10-driver operation. Against a route optimisation platform cost of $300/month, the return is not close.
Not every operation will realise every saving immediately. But any two or three of these strategies implemented well will move your cost per delivery measurably in the first month.
Where to Start
The sequence matters. Start with the strategies that cost nothing or close to nothing, and use the savings to fund the ones that require investment.
Week one: calculate your current cost per delivery and break it down by route. This takes 30 minutes and everything else depends on it.
Week two: implement a vehicle maintenance log and review driver behaviour data if you have GPS tracking. Both are zero-cost.
Month one: implement automated customer notifications if your platform supports it, and start structuring delivery time windows. Both should reduce failed deliveries and support calls within weeks.
Month two onwards: if you’re still planning routes manually at this point, the cost savings from route optimisation software should now be obvious from the data you’ve been tracking. The investment decision is much easier to make when you know exactly how much you’re spending on inefficiency.
Try Bodha Fleet free for 7 days. Route optimisation, automated notifications, proof of delivery, and full analytics included. No credit card required.
Frequently Asked Questions