 Ruchita Purohit
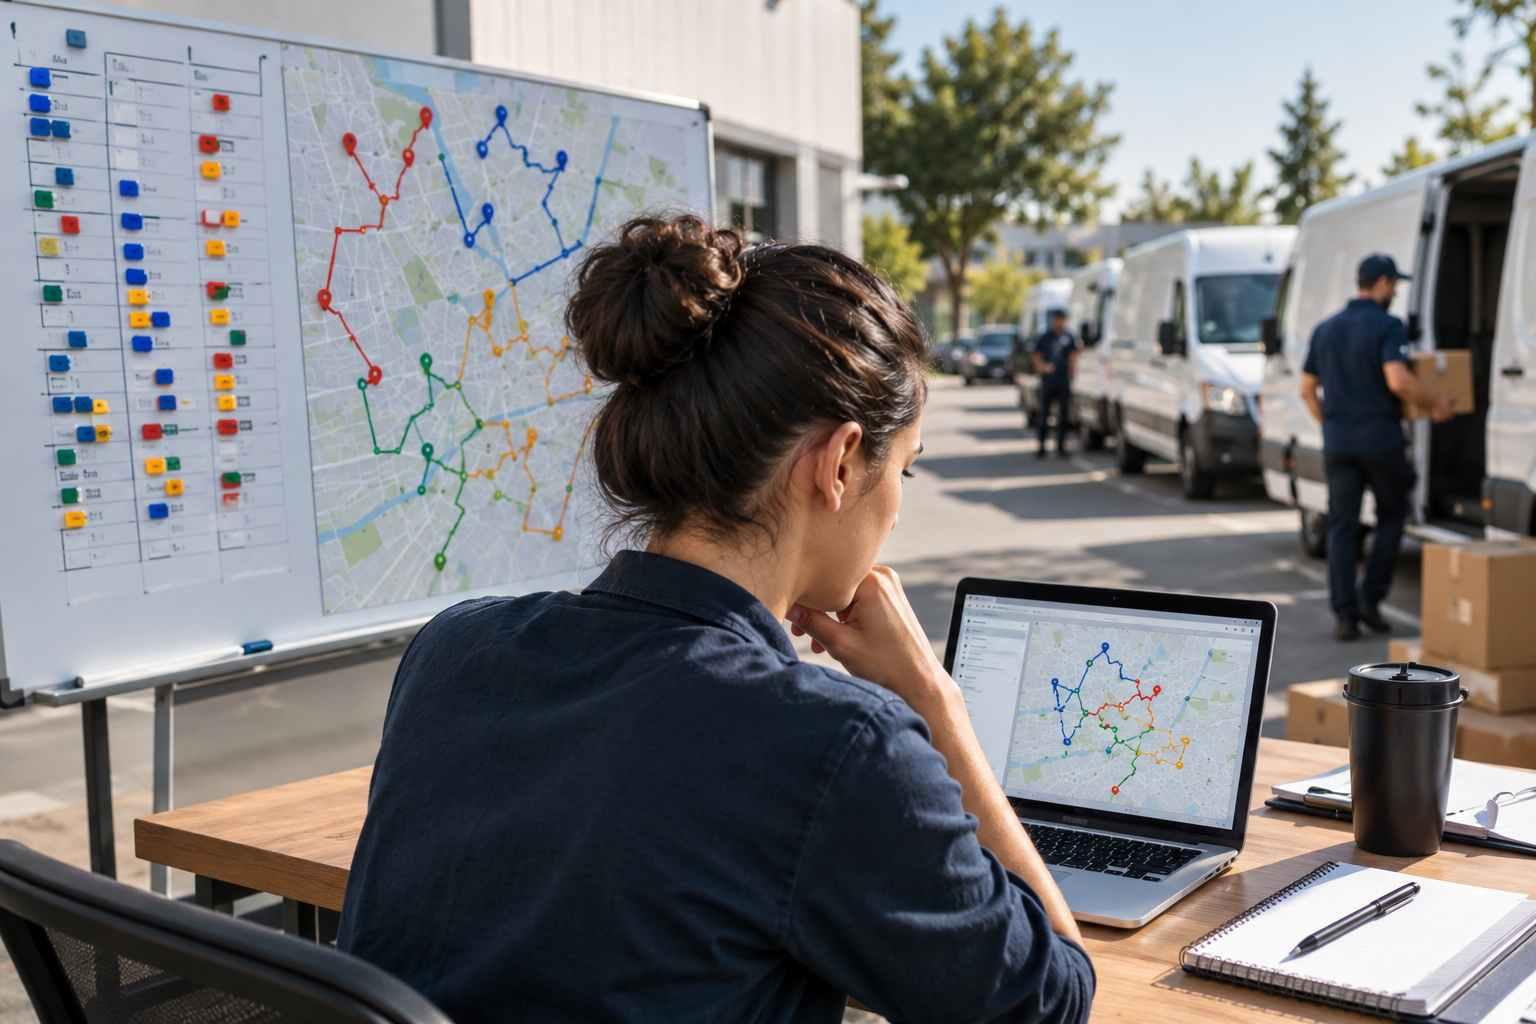
Picture a dispatcher staring at a whiteboard covered in magnets. Each magnet is a delivery. Each column is a driver. She has been moving magnets around for 40 minutes trying to figure out how to fit 180 stops across 12 drivers while keeping her two biggest accounts within their morning delivery windows.
She will get it close. Not great, but close. Then a driver will text that his van will not start. And the whole board needs to be reworked.
This is what last mile delivery optimization looks like at most small operations. It is a daily puzzle solved by hand, by someone with a lot of experience and not enough time. And it works, sort of, until it does not.
The problem is that almost everything written about last mile delivery optimization is aimed at companies with 500 trucks and a logistics team with advanced degrees. Digital twins. Machine learning demand forecasting. Autonomous vehicle integration. None of it applies when you are running 10 to 30 drivers out of a single depot and your biggest technology investment last year was a new label printer.
This is for the teams doing real deliveries with real constraints. The strategies here are things you can actually implement, most of them within a week, with last mile delivery software that costs less than a tank of fuel per driver per month.
Why Last Mile Delivery Optimization Matters More Than You Think
The last mile is where delivery economics fall apart. It accounts for 53% of total shipping costs, according to Capgemini research. Not 53% of the distance. 53% of the cost. The math makes sense once you think about it. A truck moving 500 packages from a warehouse to a regional hub is efficient. One driver making 25 individual stops across a metro area, navigating traffic and parking and apartment buildings and customers who are not home, is not.
The average last mile delivery costs $10.10 per stop. For a team running 200 deliveries a day, that is over $2,000 in daily delivery costs. Even small improvements compound fast at that scale. Shaving a dollar off each delivery saves you $500 a week. Over a year, that is $26,000 you can put toward better equipment, another driver, or just keeping the lights on during a slow month.
But here is what most optimization guides miss entirely. The savings from last mile delivery optimization are not just about fuel and miles. The biggest gains come from fixing the things that waste your team’s time in ways nobody tracks. The 20 minutes your dispatcher spends reworking routes when a driver calls in sick. The three failed deliveries that each cost you $17 to $18 in wasted driver time, fuel, and re-delivery attempts. The customer who cancels because you could not give them a time window narrower than “sometime between 9 and 5.”
Those costs do not show up on any report. But they add up to more than the fuel bill.
8 Last Mile Delivery Optimization Strategies
1. Stop planning routes manually
Here is a question nobody wants to answer honestly. How long does it take your dispatcher to plan tomorrow’s routes?
If the answer is “an hour” or “most of the afternoon,” you are paying someone skilled to do work that software handles in seconds. And the routes they produce are not as good. Not because your dispatcher is bad at their job. Because the math is genuinely impossible to do in your head.
A 25-stop route has over 15 septillion possible sequences. That is a number with 25 digits. Your dispatcher’s experience tells them that stop A is close to stop B and stop C is on the way, and that gets them a decent route. But “decent” typically means 20 to 30% more miles than necessary.
Route optimization software factors in real road distances, live traffic, vehicle type, time windows, capacity constraints, and stop priorities simultaneously. It does not just connect dots on a map. It calculates the fastest sequence considering every variable your dispatcher is trying to juggle mentally.
The time savings alone justify the switch. But the route quality is where it gets interesting. Research from ResearchGate shows route optimization reduces fuel costs by 20%. That is not theoretical. That is actual fuel you stop buying.
2. Build delivery territories that make geographic sense
Most small delivery teams assign routes the same way they always have. Whoever was free got whatever came in. Or territories were drawn based on zip codes because that was easy, not because it made operational sense.
Bad territory planning is the silent killer of delivery efficiency. When two drivers’ routes cross each other three times during a day, that is miles and minutes wasted on both sides. When one driver has 30 stops in a tight neighborhood while another has 15 stops spread across 40 miles of highway, your utilization is lopsided.
For teams with 8 to 20 drivers, territory planning does not need to be complicated. Start by mapping last month’s stops. You will see clusters. Group those clusters into zones that each represent roughly equal workloads, not equal geographic areas. A dense urban zone might cover two square miles. A suburban zone might cover 20. What matters is that each zone produces a similar number of stops and similar total drive time.
Then assign drivers to zones consistently. A driver who knows their territory delivers faster. They know which apartment complexes have rear entrances, which businesses close early, which streets get gridlocked after 3 PM. That local knowledge is worth more than any algorithm.
3. Use time windows without letting them destroy your routes
Time windows are the feature every customer wants and every dispatcher dreads. “We need our delivery between 10 and noon.” Sounds reasonable. Until you have 15 customers who all want morning deliveries and three who need afternoon, and your routes turn into chaos.
The trick is not avoiding time windows. It is structuring them so they work with your routing instead of against it.
Offer time windows that align with your natural delivery patterns. If your routes naturally flow north to south through a metro area, your northern stops should have earlier windows and southern stops later. You are not changing how you deliver. You are setting expectations that match reality.
Flexible windows beat rigid ones every time. Instead of promising “10 AM to 12 PM,” try “morning” with an automated notification 15 minutes before arrival. The customer gets what they actually want, which is enough notice to be ready, and your routing engine keeps the flexibility it needs to build efficient routes.
When a customer absolutely needs a hard time window, optimize around it. Put that stop as a fixed anchor and let the software sequence everything else. One rigid window in a route of 25 stops barely affects efficiency. Ten rigid windows in the same route can double your drive time.
4. Make failed deliveries nearly impossible
A failed delivery is the most expensive thing that can happen on a route. The driver showed up, spent the time, burned the fuel, and came back with the package still on the truck. Industry data puts the cost at $17 to $18 per failed delivery. And 8 to 20% of parcels fail on the first attempt.
If you are running 200 deliveries a day and hitting a 15% failure rate, that is 30 failed deliveries. At $17 each, you are burning $510 a day. Over $2,500 a week. Just from stops where nobody was home or the address was wrong.
The fix is not complicated. It is three things working together.
First, delivery notifications. An automated text that says “your delivery arrives in about 15 minutes” gives the customer time to step outside, unlock the gate, or call you if there is a problem. Far fewer “where’s my order?” calls. But more importantly, the customer is actually there when the driver arrives.
Second, real-time tracking links. A link in that text message that shows the driver on a map, heading toward the customer’s address. Customers check their tracking an average of 2.5 times per delivery. Each check is a call that did not happen, and a customer who is paying attention when the driver pulls up.
Third, proof of delivery. A photo at the door with a GPS timestamp eliminates the “I never got it” dispute entirely. Ten seconds per stop for the driver. Hours of back-and-forth eliminated for your office.
5. Give drivers a reason to follow the route
You can build the perfect route and it does not matter if the driver ignores it.
This happens more than anyone admits. Drivers who have been running the same area for years trust their gut over any app. And sometimes they are right. But usually they are wrong by enough to matter. A driver who goes off-route typically adds 15 to 20% more miles without realizing it because the shortcuts they “know” have not accounted for a new traffic pattern or a road closure that happened three months ago.
The solution is not telling drivers they are wrong. It is making the app easier than their old way. If following the route means opening a clunky app, waiting for it to load, squinting at tiny text, and tapping through four screens to mark a stop complete, they will go back to their clipboard.
A good driver app gives them stops in order, one tap to navigate, one tap to complete. It should hand off to whatever map app they already use. Google Maps, Waze, Apple Maps. Let them navigate in the app they trust. Just make sure the sequence comes from the optimization, not their memory.
And here is a small thing that makes a big difference. Do not require drivers to create accounts or remember passwords. No-login driver links let you send a route to any driver as a simple link. They tap it, the route loads, and they start driving. That removes the single biggest barrier to driver adoption, which is the driver deciding the app is more trouble than it is worth.
6. Re-optimize mid-route when the day falls apart
Morning route optimization gets you about 60% of the way there. The other 40% is what happens after the drivers leave.
A customer calls at 10 AM with a same-day add-on. Another customer cancels at 11. Your most experienced driver finishes his route early and could take five stops from the driver who is running behind. A road closure forces a detour that throws off your entire east-side route.
This is where spreadsheet planning falls apart completely. Once the whiteboard is set and the drivers are out, changes mean phone calls, texting, and hoping the driver checks their messages before making three unnecessary stops.
Mid-route re-optimization handles this automatically. Add a stop in the software, and it recalculates the rest of that driver’s sequence in real time. Remove a stop, same thing. Reassign stops between drivers with a drag and drop, and both routes update instantly.
The teams that get the most out of last mile delivery optimization are not the ones with the best morning plans. They are the ones who can react fastest when the morning plan stops being accurate, which is usually by 10 AM.
7. Track what matters and ignore what does not
Every fleet management platform offers analytics. The problem is that most of them dump 47 metrics on a dashboard and call it visibility.
For a small delivery team, three numbers tell you almost everything you need to know.
Stops per hour. This is your efficiency number. Well-optimized routes in dense areas produce 4 to 8 stops per hour depending on stop duration and distance between stops. If your drivers are consistently below 4 in an urban setting, your routing needs work. If they are above 6, do not fix what is not broken.
On-time delivery rate. This is your quality number. Track it by driver, by day, by territory. If one driver is consistently below 85% while everyone else is above 95%, the problem is not routing. If every driver drops on Tuesdays, your Tuesday volume exceeds your Tuesday capacity.
Cost per delivery. This is your business number. Take your total daily cost, which includes driver pay, fuel, vehicle cost, office overhead, and divide by completed deliveries. Track it weekly. It should go down as your optimization improves. If it is going up, something is wrong that metrics two levels deeper will not explain.
Route analytics should show you these numbers without making you build custom reports. Planned versus actual comparisons, driver scorecards, and trend lines over time. If getting a clear answer requires exporting to Excel and building pivot tables, you are spending optimization time on reporting instead.
8. Match your optimization to your industry
A pharmacy delivery operation has completely different optimization priorities than a building supply company. Treating them the same wastes money.
Pharmacy and medical deliveries are time-sensitive and lightweight. Routes can handle 30 to 40 stops because each one takes two minutes. The priority here is narrow time windows and chain-of-custody compliance. Optimize for on-time rate over everything else. A late medication delivery is not an inconvenience. It is a health risk.
Florist and perishable deliveries are time-sensitive in a different way. The product degrades. Routes need to be short in total duration, not just in miles. Optimize for route completion time and load your vehicles in reverse delivery sequence so the last arrangement loaded is the first one delivered.
Building supply and heavy freight runs are capacity-constrained, not time-constrained. You might only fit 8 deliveries on a truck. Optimize for minimizing miles per stop because fuel costs on a loaded truck are three to four times what they are for a delivery van. Weight-restricted roads and low bridge clearances matter here in ways they do not for a courier.
Waste collection routes are the most unique. Same stops every week. Same sequence usually works. The optimization is about multi-haul planning, knowing exactly when the truck needs to return to the transfer station to dump before continuing. Capacity-aware routing that schedules those return trips at the optimal point in the route can add two to three additional pickups per shift.
Whatever your industry, the principle is the same. Optimize for the constraint that costs you the most. For some that is time. For others it is fuel. For others it is failed deliveries. The strategy changes. The math does not.
What Your First Week of Last Mile Optimization Looks Like
You do not need a three-month implementation timeline. Here is what actually happens.
Day 1. Import your stops into the platform. Most delivery teams use spreadsheets, so this is usually an upload. If you have been using paper, type in your regular stops. This takes 30 minutes to an hour depending on how many regulars you have. Run your first optimized route. Compare it to what you would have planned manually. The difference will be obvious.
Days 2 and 3. Get your drivers on the app. Send them a route link. Walk them through it once. “Tap here for the next stop. Tap here to navigate. Tap here when you are done.” If someone pushes back, give them one day running it alongside their old method. They will see the difference.
Days 4 and 5. Turn on customer notifications. Start with delivery completion notifications, the one that says “your delivery has been completed” with a photo. This is the easiest to set up and produces immediate results because your post-delivery “did it arrive?” calls drop to almost zero.
Week 2. Add pre-delivery notifications. Start tracking your stops per hour and on-time rate. Adjust your territories based on what the data shows. You are optimizing now, not just delivering.
Most teams see measurable improvements within the first week. Not because the software is magic, but because even basic route optimization eliminates the most obvious inefficiencies immediately.
The Math That Makes This Decision Easy
Take a 10-driver team doing 20 stops each per day. That is 200 deliveries.
Route optimization saves an average of 30 minutes per driver per day through shorter routes and smarter sequencing. That is 5 hours of driving time recovered daily. At $25 per hour loaded cost, that is $125 per day. $625 per week. $32,500 per year.
Cutting your failed delivery rate from 15% to 5% saves 20 failed deliveries per day. At $17 each, that is $340 daily. $1,700 per week. Over $88,000 per year.
Your dispatcher gets back 2 hours per day that she was spending on manual route planning and fielding status calls. That is time she spends on the work that actually grows the business.
Last mile delivery management software like Bodha costs $29.99 per user per month. For 10 drivers and a dispatcher, that is roughly $330 per month. You are saving more than that in the first week.
The question is not whether you can afford route optimization. It is how much longer you can afford to run without it.
FAQ's
What is last mile delivery optimization?
Last mile delivery optimization is the process of making the final leg of delivery, from depot or warehouse to the customer's door, as efficient as possible. It covers route planning, driver allocation, delivery time windows, real-time adjustments, and customer communication. The goal is reducing cost per delivery while improving on-time rates and customer satisfaction.
How much does last mile delivery cost?
The average last mile delivery costs $10.10 per stop, and the last mile accounts for 53% of total shipping costs according to Capgemini research. Route optimization software typically reduces these costs by 20 to 30% through shorter routes, fewer failed deliveries, and better driver utilization.
What is a good stops-per-hour rate for delivery drivers?
Well-optimized routes in dense areas produce 4 to 8 stops per hour depending on stop duration and distance between stops. Most unoptimized operations run 2 to 4 stops per hour. Route optimization software improves this by sequencing stops more efficiently and reducing backtracking and unnecessary miles.
How do I reduce failed deliveries?
Failed deliveries cost $17 to $18 each. The most effective approach combines three things: automated delivery notifications so customers know when to expect you, real-time tracking links so they can watch the driver approach, and proof of delivery photos so there is no question about whether the delivery arrived.
Can small delivery teams benefit from route optimization?
Yes. Route optimization delivers outsized returns for small teams with 5 to 50 drivers because every minute saved multiplies across every driver every day. A 10-driver team saving 30 minutes per driver per day recovers 25 hours of driving time per week. That is the equivalent of hiring a part-time driver without paying for one.
How long does it take to implement route optimization software?
Most small delivery teams are fully operational within one week. Day one involves importing your stops and running your first optimized route. By day three, drivers are using the mobile app. By the end of the first week, customer notifications and tracking are live. No IT department required. No hardware to install.