
 Ruchita Purohit
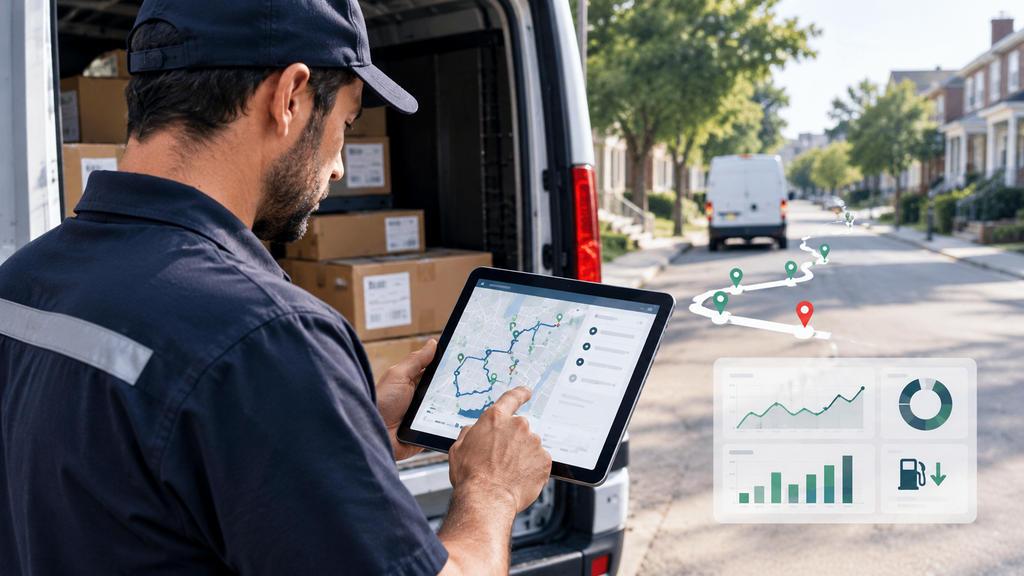
Take a fleet owner who ran 14 drivers for almost two years, completely convinced his operation was in good shape. Routes finished on time, more or less. Customers weren’t blowing up his phone. Drivers showed up, did the work, went home.
Then one evening he actually pulled up his delivery analytics. Not a quick glance, but a real, sit-down-with-coffee kind of look.
What he found was ugly.
One driver had been finishing an hour and a half late every single day for six weeks running. Nobody caught it because the guy never said a word. Two routes were crossing over each other in the same zip code, which meant two vans on the same streets within an hour of each other, both burning gas for no reason. And that big client he thought was carrying his business? Once he added up the reattempts, the overtime, and a failure rate north of 14% on their stops alone, he was actually losing $1.40 on every delivery he made for them.
He had all the data. It was sitting right there in his software the whole time. He just never sat down and read it.
This story is not unusual at all. Plenty of courier teams have the same blind spot. They collect delivery data every day just by running their operation. Stop times, route durations, which deliveries made it on the first try, which ones didn’t. All of it gets logged. Almost none of it gets looked at until something goes really wrong.
That gap between collecting data and actually using it is what last mile delivery analytics is supposed to close.
What does last mile delivery analytics even mean?
Okay, so the term gets thrown around a lot, and half the time people use it to mean “we have a dashboard.” That’s not it.
Last mile delivery analytics is what happens when you take all that delivery data your operation generates every day and you start pulling on threads. You notice that your failure rate spikes every Thursday. You notice that one driver’s stops-per-hour dropped from 7 to 4 over three weeks. You notice that a route you thought was tight is actually running 40 minutes over plan every single time.
And then, this is the part most people skip, you actually do something about the pattern you found.
Noticing that Thursday failure spike is analytics. Digging in and realizing it happens because your biggest apartment complex does maintenance every Thursday afternoon and blocks the loading area, that’s context. Moving those stops to Wednesday morning, that’s the fix. Watching your failure rate drop the following week, that’s the payoff.
Without the first step you’d never catch it. But the first step alone doesn’t save you anything.
I’ve seen operators get this backwards in a painful way. They’ll invest in software, get a beautiful dashboard, show it off at a team meeting, and then never open it again. The dashboard becomes wallpaper. Meanwhile the same problems keep chewing through their margins week after week.
A quick note on what analytics can't do
I feel like I have to say this because the industry oversells this stuff constantly.
Your delivery analytics will never be smarter than a dispatcher who’s been on the job for a decade. That dispatcher knows that the crew at your northwest warehouse loads pallets 20% faster when Danny is on shift. She knows the back entrance to the medical plaza on 4th Street saves ten minutes per stop. She has a mental map of which drivers handle pressure well and which ones fall apart when the route gets rearranged at noon.
No software captures that. What software does is catch the patterns she physically cannot see. The slow drift in a driver’s performance over six weeks. The contract that’s been quietly unprofitable since March. The route that works great in summer but falls apart every winter because of school bus schedules she forgot about.
Experience spots the obvious stuff. Delivery analytics catches the invisible stuff. You need both.
The money side of this, because that's what actually matters
Let me walk you through some math that I think will bother you. It bothered me the first time I ran these numbers for our own operation years ago.
Say you’ve got 15 drivers. Each one does about 100 stops a day. That’s 1,500 deliveries daily, ballpark 33,000 a month.
Now, hidden inefficiency. I’m talking about things like routes that backtrack because they weren’t sequenced well, deliveries that fail and need a second attempt, a driver sitting idle for 20 minutes because the route had a gap in it, overtime that happened because one route was overloaded while another finished early. None of these things are dramatic on their own. They don’t trigger any alarm.
But say all of those little things add up to fifty cents of waste per delivery. That’s conservative. For a lot of operations it’s closer to a dollar.
Fifty cents times 33,000 deliveries is $16,500 a month. Almost $200,000 a year. Just gone. Not to any one thing. Not to some obvious failure. Just a thousand tiny leaks that nobody was watching for.
The teams growing their margins right now didn’t find some secret. They started measuring. They looked at their last mile delivery analytics regularly. They plugged the leaks one at a time. And the compound effect over three or four months was significant.
The five problems your delivery data is trying to tell you about
I keep seeing the same problems show up across different types of delivery operations. Couriers, food distributors, pharmacy delivery, furniture, doesn’t matter. The same five issues drain profit everywhere.
Failed deliveries cost way more than you think
Everyone says they know failed deliveries are expensive. But very few operators actually know how expensive.
When a first-attempt delivery fails, you’ve already spent the fuel, the driver’s time, and a slot on the route. That’s a sunk cost. Then you reattempt it tomorrow, which doubles the cost. The customer calls asking where their package is, so now your support team is involved. And the customer’s trust takes a hit, which is the hardest cost to measure but probably the most important one.
All-in, a single failed delivery lands somewhere around $15 to $20 depending on your operation. I’ve seen some teams where it’s higher because they’re running specialty deliveries that take longer per stop.
But here’s where delivery analytics changes the game. Instead of just knowing your fleet-wide failure rate is 9% (bad, by the way), you start seeing the shape of the problem. You might discover that a single apartment complex in one part of town is responsible for almost a quarter of your total failures that month. And the reason? Nobody ever put the gate code in the delivery notes. Every driver that pulls up has to call the customer, wait, try the front desk, wait some more. Half the time the customer doesn’t pick up and the delivery fails.
Two minutes to update the notes. That’s it. Problem solved. But you’d never find it without looking at the data by location.
Or maybe your analytics show that failures spike between 11 and 1 PM on residential routes. Nobody’s home at lunch. The fix is sequencing your route so residential stops happen before 11 and after 2, and commercial stops fill that midday window.
The fleet-wide number tells you there’s a problem. Last mile delivery analytics tells you exactly where it is and usually points at something fixable.
Your best driver might be about to quit and you don't know it
Stop count is how most people measure whether routes are “fair.” Driver A gets 75 stops, Driver B gets 75 stops, looks balanced, right?
Except Driver A runs a dense downtown grid where the stops are stacked on top of each other and finishes by 3:30. Driver B covers a sprawling suburban territory with gated communities, long driveways, and commercial buildings that require loading dock coordination, and she’s still out at quarter to seven.
She’s not going to complain about it. Not at first. Good drivers almost never do. They just absorb it. But resentment builds, and one day she gives two weeks’ notice because a competitor offered a lighter route and slightly better pay, and now you’ve lost someone who knew every quirk of that territory.
I’ve seen estimates for replacing a trained delivery driver that range from $5,000 to $10,000 when you factor in recruiting, training, and the productivity dip while the new person figures things out.
The delivery analytics signal that catches this early is finishing times. Not stop count. Check it weekly. If the same person is finishing last every single day by a wide margin, something is off and it’s worth a conversation before it becomes a resignation.
The awkward one nobody wants to talk about
I’ll just say it plainly. Sometimes your data shows a driver averaging 9 or 10 minutes per stop when comparable drivers on similar routes are at 4 or 5. Or there’s a weird two-hour gap in the middle of the day with no scans, no deliveries, no movement.
Could be innocent. New driver, tough neighborhood, bad parking situation. Fine. Happens all the time.
Could also be someone running errands on the clock, taking extended breaks, or just not putting in full effort. And look, I’m not saying assume the worst. I’m saying look at the data, notice the pattern, and have a conversation. The data doesn’t accuse anybody. It just says “hey, this looks different from the baseline.”
Without delivery analytics you’d never see it. The route gets done, the packages get delivered (mostly), and you pay for a full day of work without knowing you only got five hours of real productivity out of it.
Some routes are just built wrong
A route can look perfectly reasonable on a screen and be a nightmare on the road. Construction reroutes that add 15 minutes. A cluster of apartment buildings where parking is a fight every single time. A stretch of highway that turns into a parking lot between 4 and 6 PM.
If a route consistently runs 30 or 40 minutes over plan, and this pattern holds no matter which driver runs it, the problem isn’t the driver. It’s the route. The stop count might be too high. The time windows might be unrealistic. The plan might not account for conditions that exist every single day but weren’t there when the route was first designed.
On the other hand, if the route runs fine with one driver and falls apart with another, you might have a match issue. Not a performance problem, just a case where the wrong person is on the wrong territory. Your downtown veteran will crush an urban route that would wreck a suburban-focused driver, and vice versa.
Delivery analytics makes this visible through planned vs. actual comparisons. But you need a few weeks of data to see the real pattern, not just a single bad day.
That growing account might be shrinking your margin
This one is the most counterintuitive and probably the most important.
A client gives you 200 stops a day. Volume goes up, team stays busy, it feels like your business is growing. Except you never ran the cost-per-delivery math on that specific account.
Their stops are scattered across a huge area, so your route efficiency tanks. They require signatures on every delivery, adding a minute or two per stop. Their recipients are hard to reach, so your failure rate on their stops is running at 14% while your average is 6%. And the rate you negotiated per delivery was based on none of these realities.
You do the actual calculation and find out you’re spending $11 to complete each delivery but charging $8.50. You’ve been subsidizing their business with profit from your other accounts and didn’t know it.
Last mile delivery analytics at the contract level catches this. It is maybe the most important report you can run, and barely anyone does it regularly.
Six numbers worth checking every week
I could list 30 metrics but honestly most of them don’t change how you run your day. These six do.
Cost per delivery. Total costs divided by completed deliveries. Standard parcel should be $8 to $12. If it’s climbing and your volume is flat, something is getting worse. Check it weekly by route, monthly by client.
First-attempt success rate. What percentage of deliveries get done on the first try. Strong teams are above 92%. Below 88% and you’ve got a structural problem, not bad luck. Break it down by zone, driver, and time of day to see where the failures live.
Planned vs. actual route time. How long routes actually take compared to how long you planned. If they’re regularly coming in 20% or more over the estimate, your planning assumptions need updating. Could be stop count, could be traffic patterns, could be unrealistic time windows.
Stops per hour. Completed stops divided by route hours. Urban parcel delivery usually runs 6 to 10 per hour. Suburban and rural is lower, 3 to 6 depending on density. Compare drivers on similar routes. If there’s a big gap between two people covering the same territory, figure out why.
Finishing time variance. The gap between your earliest and latest driver each day. Under an hour is healthy. Over two hours and workloads are badly off. The person finishing last every day deserves a conversation, not a write-up.
On-time rate. Percentage of deliveries inside the promised window. Below 90% puts your contracts at risk. If late deliveries cluster at the end of routes, those routes are overloaded. If they cluster on a specific day, you’ve got a staffing gap on that day.
That’s it. Track these six consistently and you’ll spot most of the problems worth fixing long before they become expensive.
Build a weekly rhythm and stick to it
The teams that get real value from delivery analytics aren’t the ones with the fanciest dashboards. They’re the ones that look at the same handful of numbers at the same time every week and act on what they find.
Monday morning, before the first route goes out: pull up last week’s numbers. Cost per delivery, first-attempt success, on-time rate. Two minutes. Are they better or worse than the week before? If worse, note which routes or drivers moved the number. If steady, carry on.
Wednesday: quick ten-minute check on finishing times from Monday and Tuesday. Anyone running way late compared to peers? Any stops-per-hour numbers that look weird? Note it but don’t react yet. One or two days of data isn’t enough.
Friday afternoon: this is the real one. Fifteen minutes. Look at where failed deliveries clustered this week and pick one fix for next week. Check which routes ran way over plan and figure out if it’s a one-off or a pattern. Glance at cost per delivery by client to make sure no contract is going sideways.
Monthly: an hour. Compare this month to last month. Are the trends headed the right direction? This is when you decide whether to hire, restructure territories, or have that difficult pricing conversation with a client.
The whole thing takes less than two hours a month. For most operations, the first fix pays for the software before the trial ends.
Being honest about the limits
I run into operators who either expect analytics to solve everything or dismiss it as useless corporate stuff. Both are wrong.
Your delivery data will tell you that a driver’s stop time doubled. It will not tell you he’s nursing a bad knee and didn’t tell anyone because he’s worried about losing shifts. A dispatcher who walks the warehouse floor every morning might notice him limping. The data won’t.
A freak snowstorm will blow up your numbers for a week. An experienced operator knows to look at rolling averages across a month, not panic over one ugly Tuesday.
If your customer addresses are wrong, incomplete, or five years out of date, your drivers are going to waste time no matter how perfect the route is. Delivery analytics will show you that address quality is a problem. Fixing the actual addresses is still manual, unglamorous work that someone has to do.
And sometimes a veteran driver goes off-route because she knows the customer at stop 14 leaves for work at noon, so she rearranges the sequence to catch him first. The analytics will flag a route deviation. A good manager will ask why before calling it a problem.
Data shows you the pattern. Your people explain it. Then you decide what to do. All three steps matter. Skip one and you’re either overreacting to noise or ignoring signals that could save you real money.
Getting started without overthinking it
Day one: import your stops and run your routes through route optimization software that tracks performance automatically. Your drivers complete stops and the data starts building. Nothing extra to do.
Day two and three: pull up whatever your software gives you. Just look at it. Finishing times, failed stops, routes that ran long. Don’t change anything yet. Just get used to what the data looks like for your operation.
End of the first week: pick one thing. One. Add a gate code to delivery notes for a problem building. Move three stops off an overloaded route. Adjust a start time by 20 minutes. Something small and specific.
Second week: did it help? If yes, pick the next thing. If no, look at why and try something different.
That’s last mile delivery analytics in practice. Not a transformation. Not a six-month project. Just looking at your numbers every week and making one small improvement at a time. The teams that stick with it see measurable gains within 90 days. Not because the technology is magical but because the problems were always there, sitting in the data, waiting for someone to notice.
If you’re looking at last mile delivery software for your team, make sure analytics comes built in and easy to read. Not buried in a premium tier. Not locked behind CSV exports and pivot tables. Right there on the screen, in a format that a dispatcher can scan in two minutes and know exactly what needs attention today.
FAQ's
What is last mile delivery analytics?
It's the practice of looking at your delivery data, things like stop times, route durations, success rates, driver hours, cost per delivery, and finding patterns that help you make better decisions. Not just collecting numbers. Actually reading them and acting on what you find.
Which delivery metrics matter most?
Six cover most of what you need: cost per delivery, first-attempt success rate, planned vs. actual route time, stops per hour, driver finishing time variance, and on-time delivery rate. Master these before adding anything else to the list.
How is delivery analytics different from delivery tracking?
Tracking tells you what happened. A delivery failed, a route ran late, a driver took longer than expected. Delivery analytics tells you why it keeps happening and what to change. Tracking is a rearview mirror. Analytics is a map.
What kind of savings are realistic?
For a team of 10 to 15 drivers, $15,000 to $50,000 per year is a reasonable range. Most of it comes from cutting failed deliveries, reducing unnecessary overtime, eliminating fuel waste on poorly sequenced routes, and catching unprofitable contracts before they drain you for another quarter.
Do I need a data analyst on staff?
Not even close. Good delivery fleet management software with built-in route analytics does the heavy lifting. If your dispatcher can read a bar chart, she can use delivery analytics. If the software requires a data science degree to get value from it, it's the wrong software.
How often should I review this stuff?
Daily glance at finishing times: two minutes. Midweek driver check: ten minutes. Friday route and contract review: fifteen minutes. Monthly big-picture trends: one hour. That's about two hours a month total. Every operator I've talked to who sticks to this rhythm says the same thing: they can't believe how much they were missing before.
Can this help me decide when to hire?
Absolutely. If routes are running over plan every week, finishing times are creeping later, and stops per hour are declining across the team, the data is telling you your drivers are stretched. Better to hire proactively based on those signals than to wait until someone burns out and quits.
Route analytics vs. delivery analytics, what's the difference?
Route analytics is one piece of delivery analytics. It covers route-specific stuff: distance, duration, sequence efficiency, how actual performance compares to the plan. Delivery analytics wraps in everything else too: delivery outcomes, driver performance, customer experience, and financials. You want both, and honestly for most delivery software they live in the same dashboard anyway.